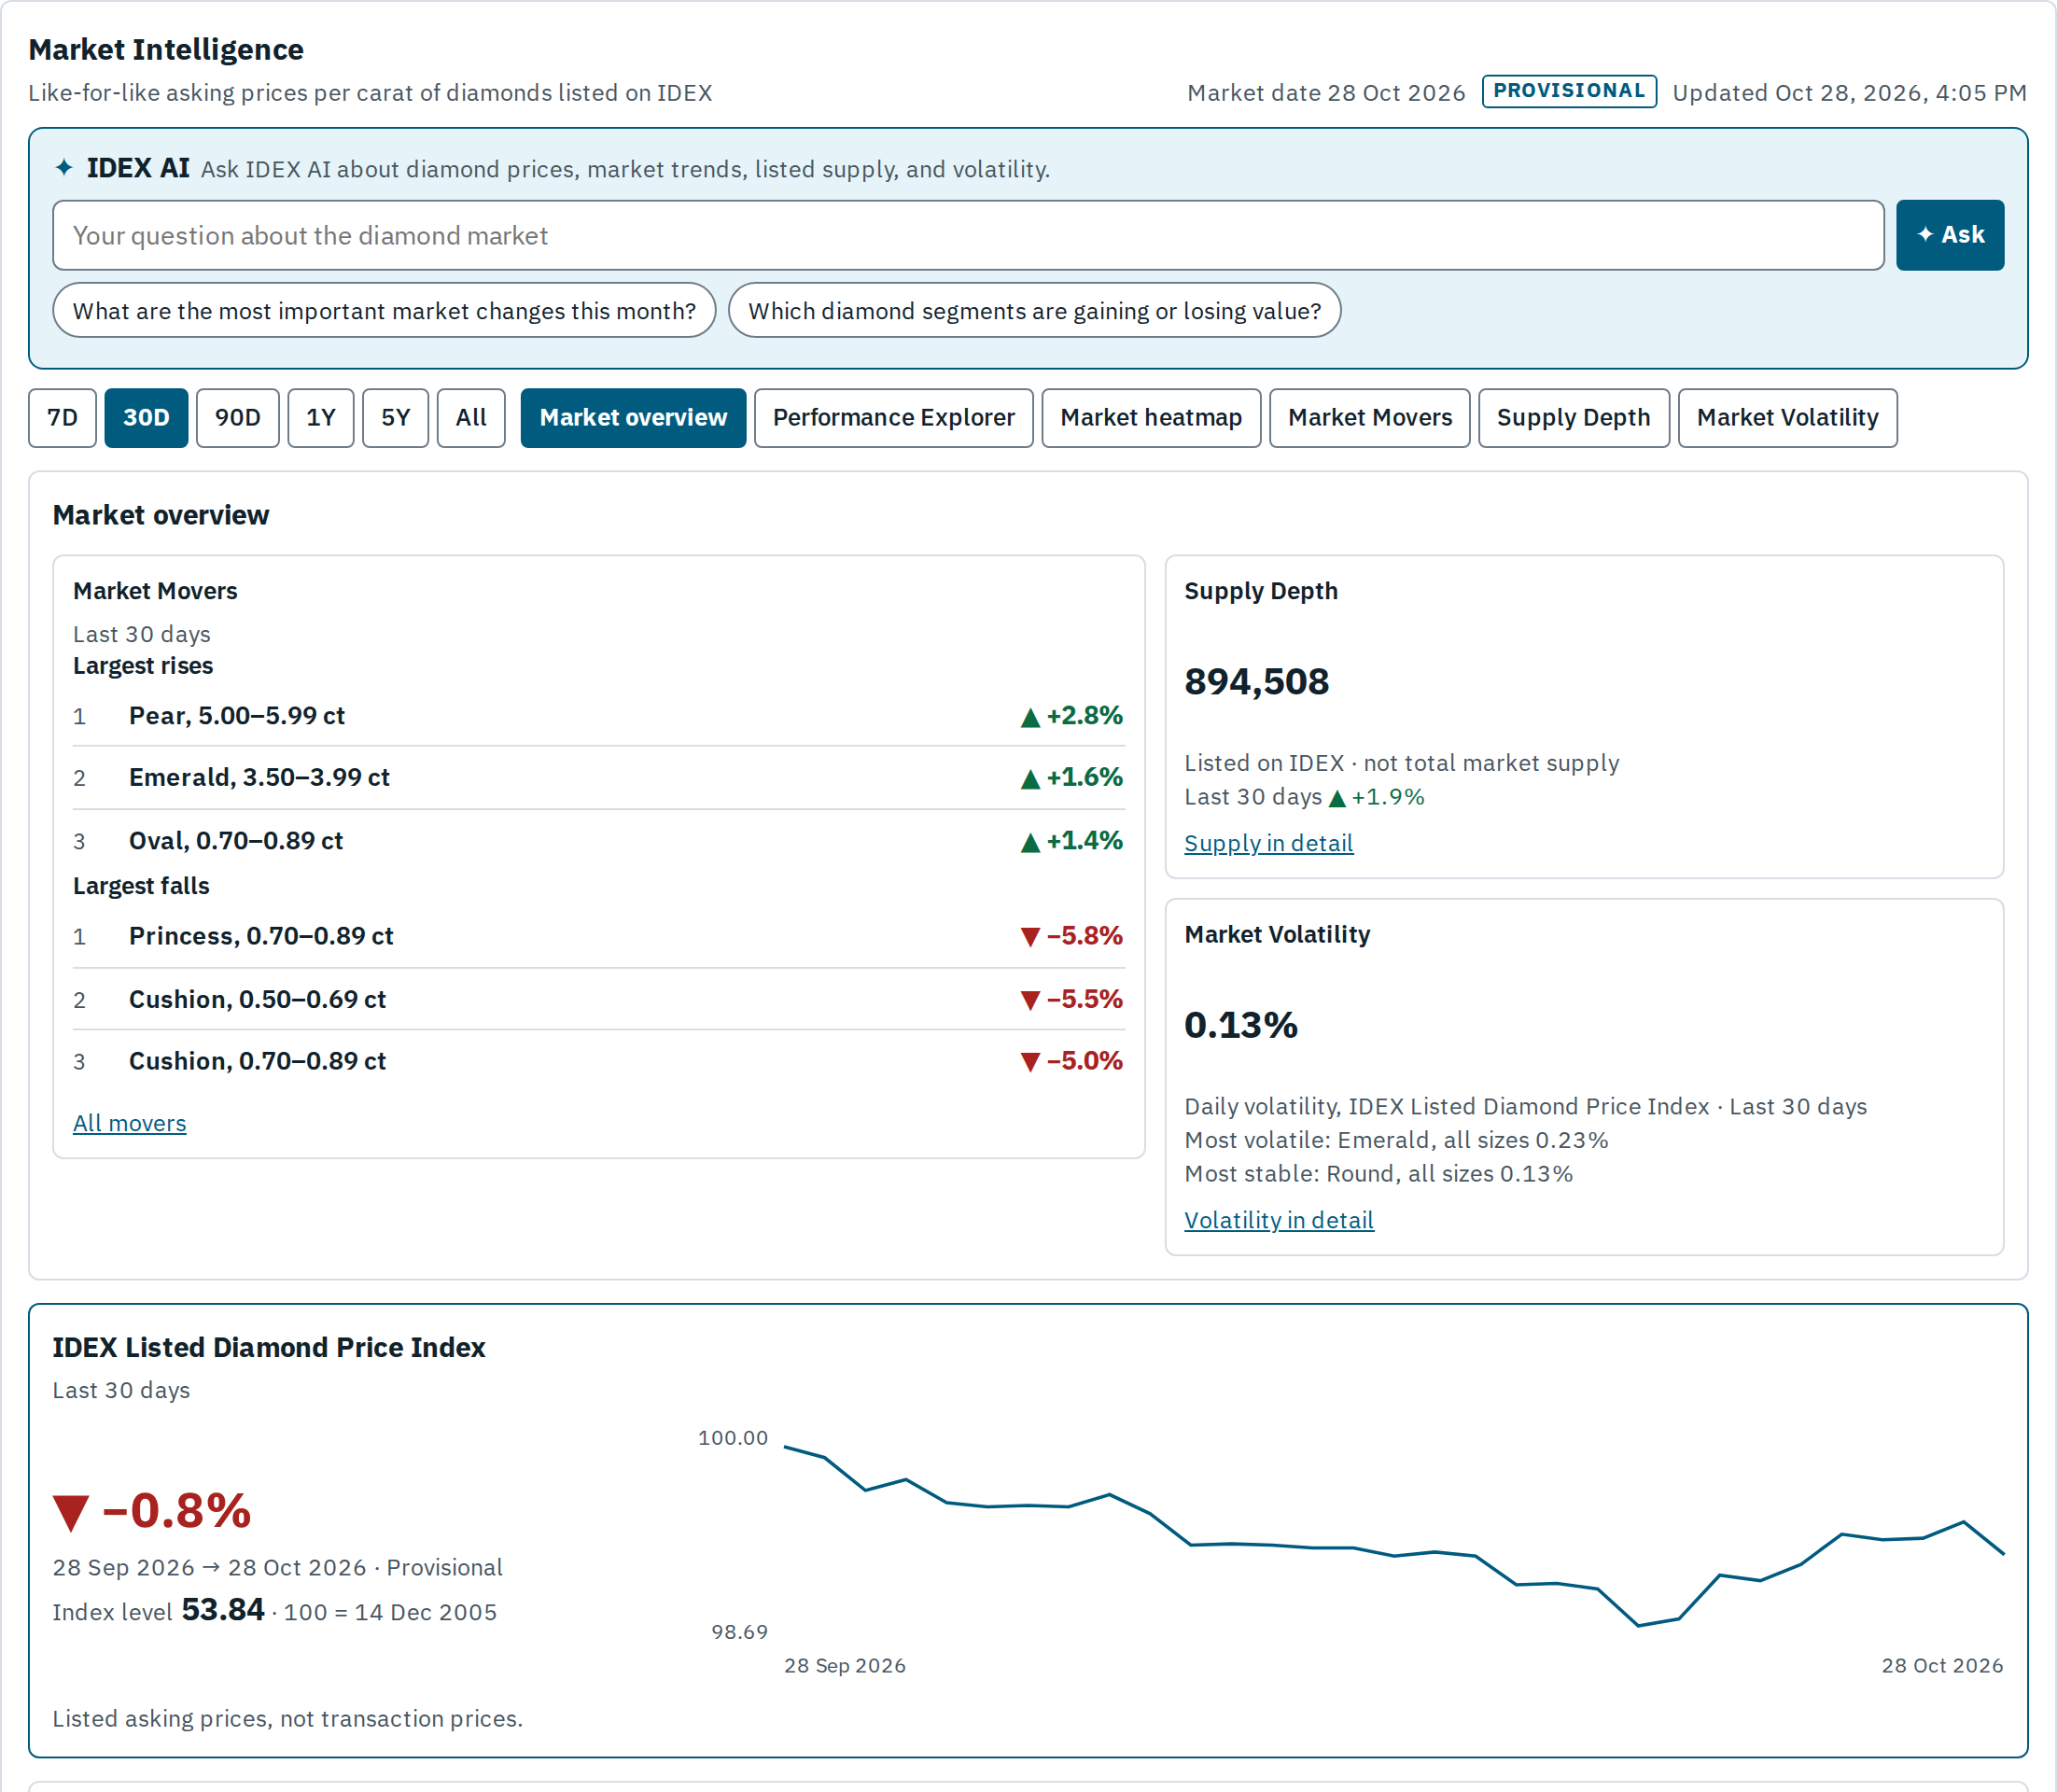
Market Trends
The IDEX Listed Diamond Price Index
A chain-linked, like-for-like, carat-weighted index of the priced IDEX catalogue shapes, 100 on 14 December 2005, with its composition one click away.
One modular product for the listed diamond market: the headline index, every segment's performance, the biggest movers, listed supply and volatility, read against more than twenty years of IDEX market data, with an AI analyst that answers from the same data.

Each module answers one question about the listed market. Together they form one product: a company receives the modules it needs, and they share one set of periods: the index, the Performance Explorer and the heatmap from 7 days to the full history, movers and supply over up to a year, volatility over up to five years.
A chain-linked, like-for-like, carat-weighted index of the priced IDEX catalogue shapes, 100 on 14 December 2005, with its composition one click away.
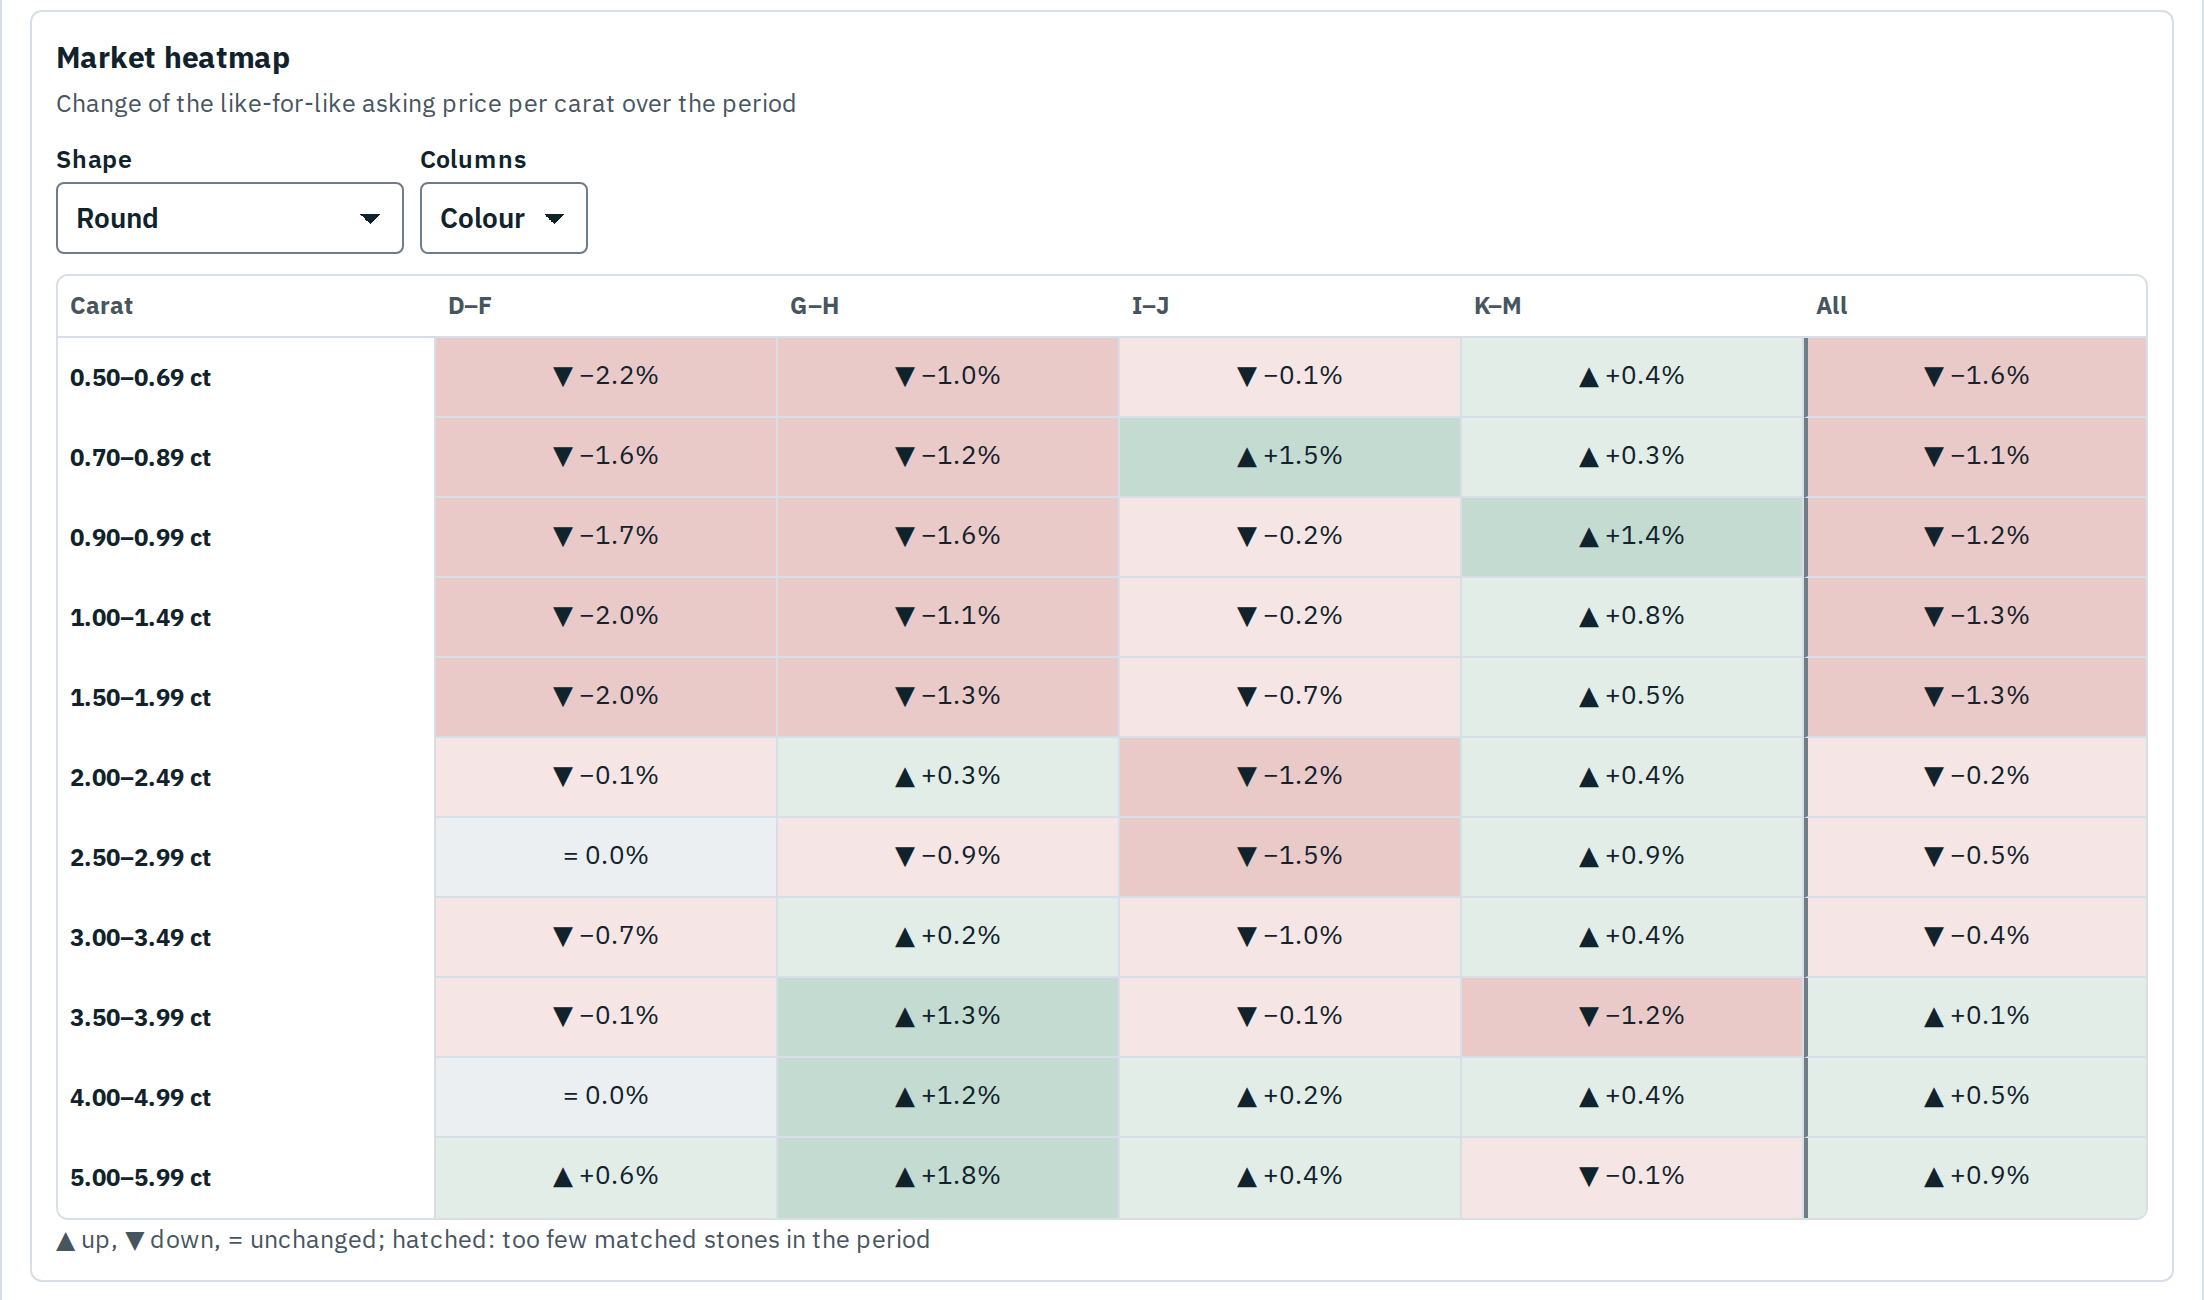
Up to four series rebased to 100 on one chart, and a heatmap of every carat group against colour or clarity bands.
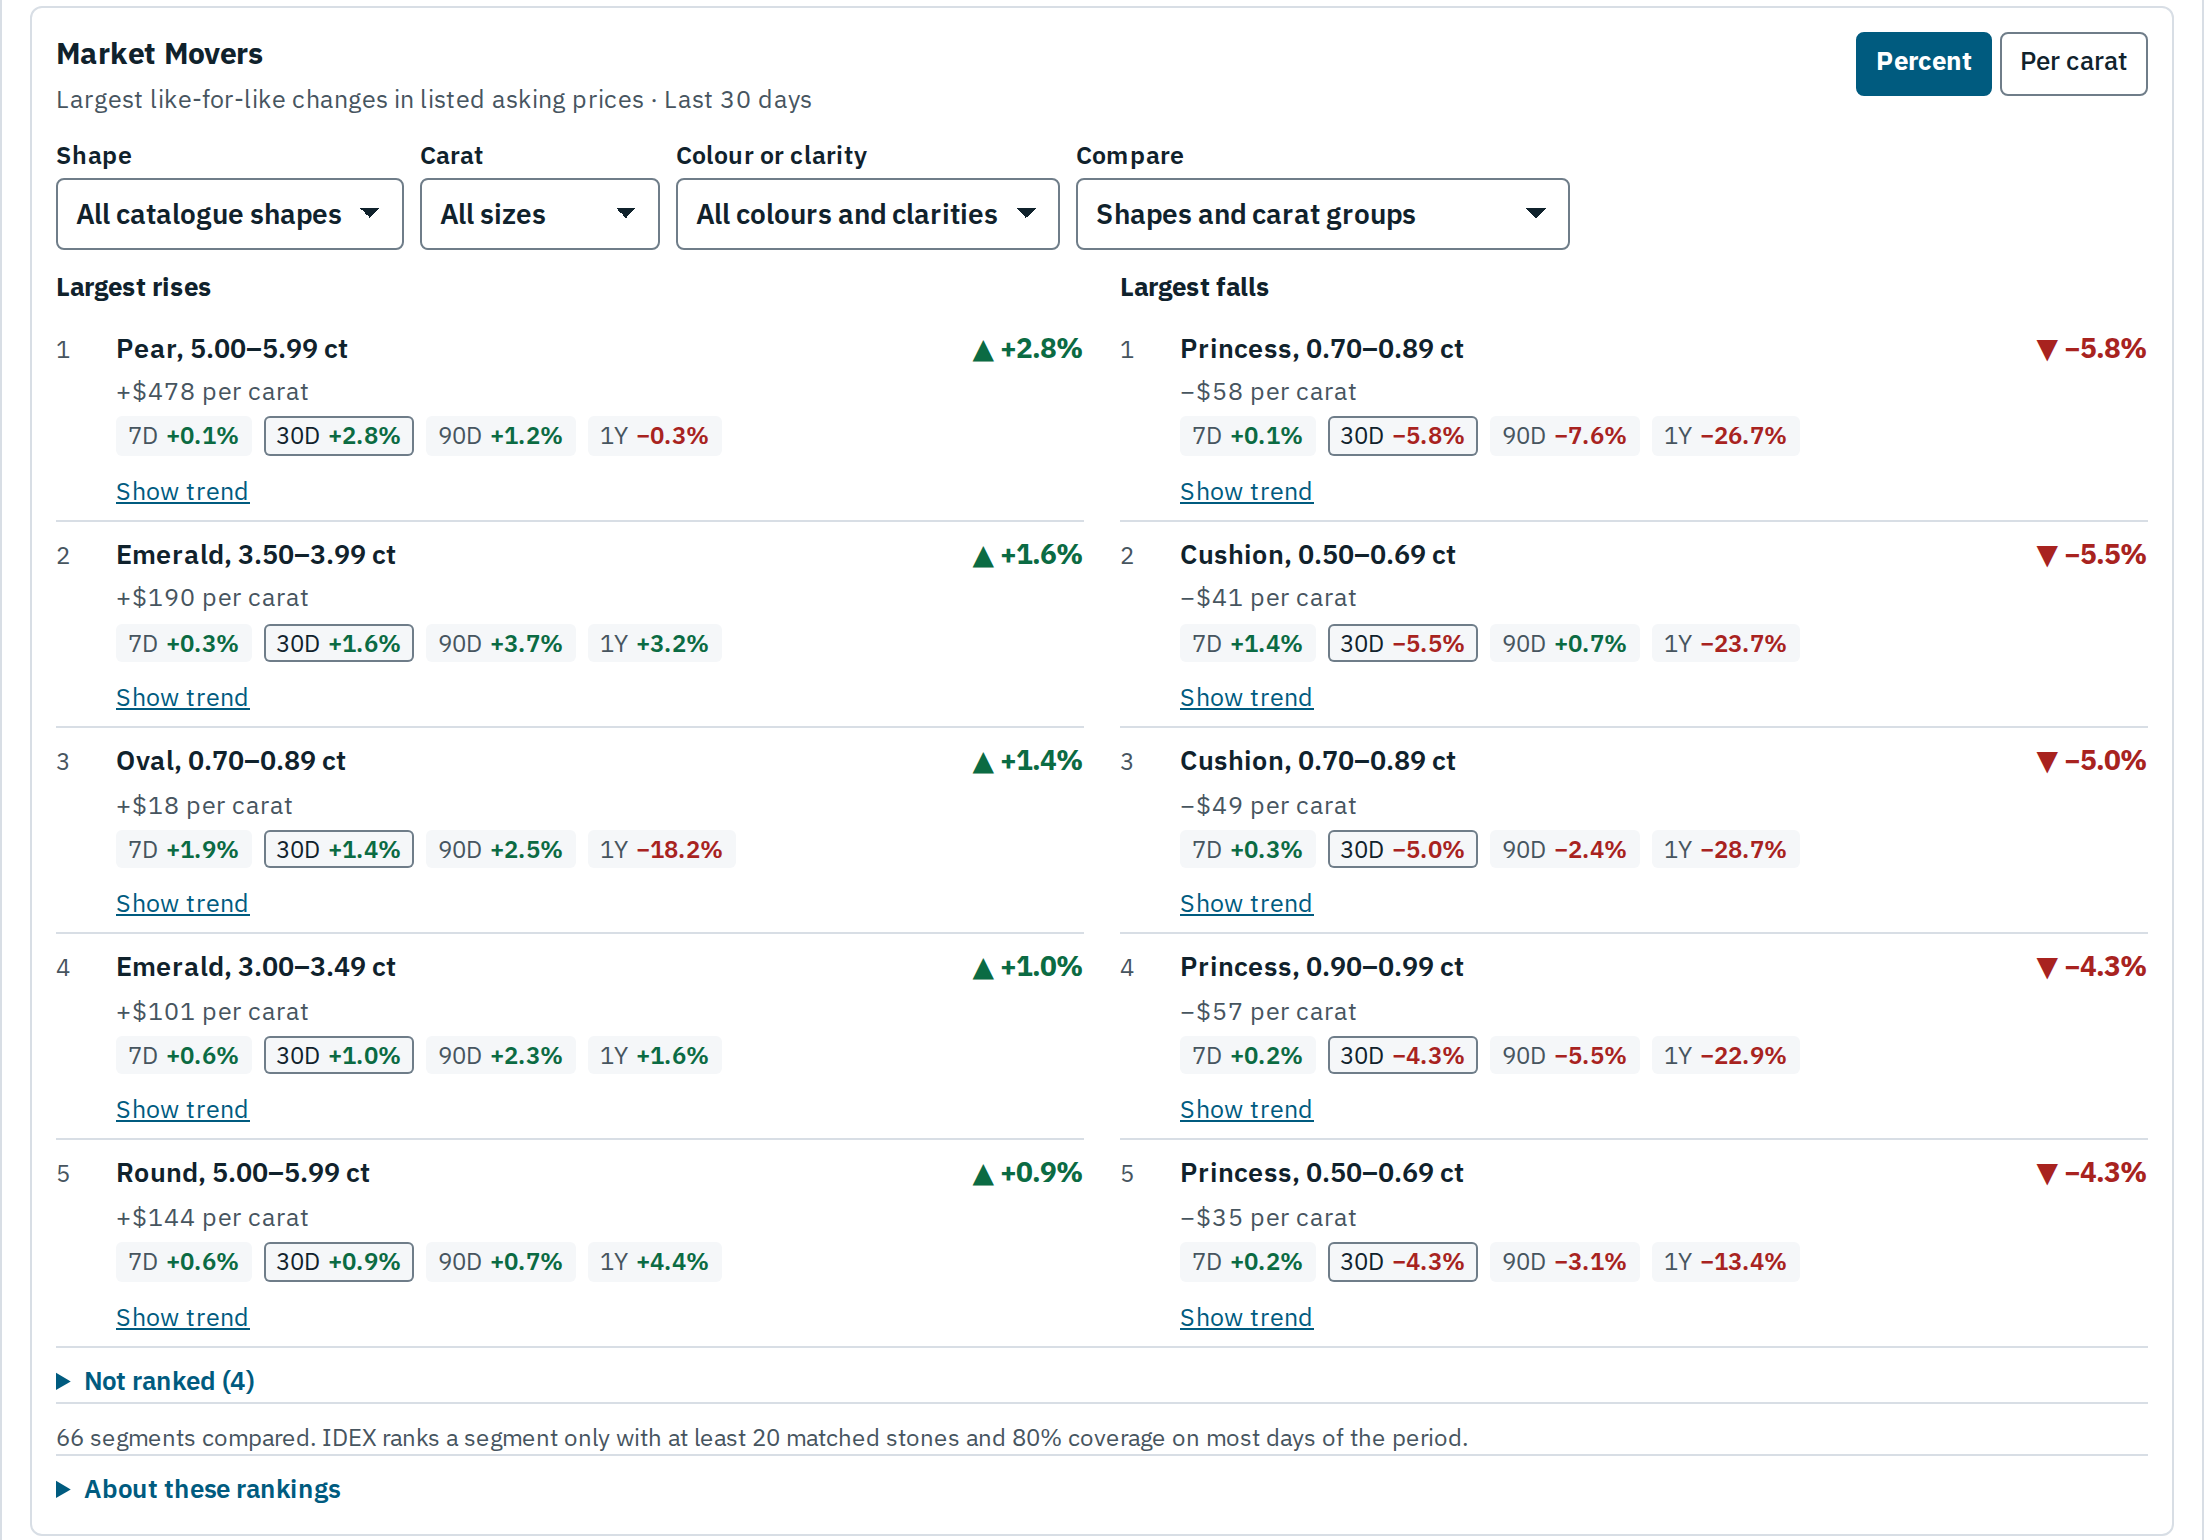
Segments ranked by per cent or by amount per carat. Segments with too few matched stones are listed apart and never ranked.
The number of diamonds listed on IDEX by shape, carat group and grade, and how it changed. It counts IDEX listings, never total market supply, and marks days when IDEX's listing base changed.
Daily moves of like-for-like listed asking prices, with the typical move, the largest rise and fall, and a stability band against the index. Not annualised.
Ask about the market in your own words. The analyst looks the figures up in IDEX data, names the period and shows its tables; unverified figures are withheld.
How IDEX AI worksThe index and three of its segments, monthly from 14 December 2005 to 28 Oct 2026. The index, the Performance Explorer and the heatmap read any period of this record, from the last seven days to the whole of it.
Rows are carat groups, columns colour bands; each cell is the like-for-like change of the listed asking price per carat over the period. This is the round heatmap for the 30 days to 28 Oct 2026, exactly as the tool served it.
| Carat | D–F | G–H | I–J | K–M | All |
|---|---|---|---|---|---|
| 0.50–0.69 ct | −2.3% | −1.0% | −0.1% | +0.4% | −1.6% |
| 0.70–0.89 ct | −1.6% | −1.2% | +1.4% | +0.3% | −1.1% |
| 0.90–0.99 ct | −1.8% | −1.6% | −0.2% | +1.4% | −1.2% |
| 1.00–1.49 ct | −2.0% | −1.1% | −0.2% | +0.8% | −1.3% |
| 1.50–1.99 ct | −2.0% | −1.3% | −0.7% | +0.5% | −1.3% |
| 2.00–2.49 ct | −0.1% | +0.3% | −1.2% | +0.4% | −0.2% |
| 2.50–2.99 ct | 0.0% | −0.9% | −1.5% | +0.9% | −0.5% |
| 3.00–3.49 ct | −0.7% | +0.2% | −1.0% | +0.4% | −0.4% |
| 3.50–3.99 ct | −0.1% | +1.3% | −0.1% | −1.2% | +0.1% |
| 4.00–4.99 ct | 0.0% | +1.2% | +0.2% | +0.4% | +0.5% |
| 5.00–5.99 ct | +0.6% | +1.8% | +0.4% | −0.1% | +0.9% |
Built into Market Intelligence in the Retailer Hub. The analyst answers only from IDEX tool results, says when the data cannot answer, and gives no forecasts and no investment advice.
Cushion, 0.50–0.69 ct, I–J led the gains (+9.00%), while Princess, 0.70–0.89 ct, K–M led the declines (−8.47%).
These are the strongest movers by percentage across shape × carat group × colour band for 2026-09-28 to 2026-10-28. The 2026-10-28 snapshot is provisional.
| Rank | Segment | Change | Matched stones |
|---|---|---|---|
| 1 | Cushion · 0.50–0.69 ct · I–J | +9.00% | 295 |
| 2 | Pear · 5.00–5.99 ct · D–F | +3.88% | 97 |
| 3 | Oval · 4.00–4.99 ct · D–F | +3.45% | 109 |
| 4 | Emerald · 3.00–3.49 ct · D–F | +2.66% | 214 |
| 5 | Cushion · 0.70–0.89 ct · K–M | +2.62% | 129 |
| Rank | Segment | Change | Matched stones |
|---|---|---|---|
| 1 | Princess · 0.70–0.89 ct · K–M | −8.47% | 171 |
| 2 | Cushion · 0.50–0.69 ct · D–F | −8.22% | 1,969 |
| 3 | Princess · 0.70–0.89 ct · I–J | −7.22% | 1,293 |
| 4 | Pear · 3.00–3.49 ct · K–M | −6.64% | 101 |
| 5 | Oval · 3.00–3.49 ct · K–M | −6.54% | 131 |
Changes measure like-for-like listed asking prices per carat, not transaction values. Segments with insufficient observations or coverage are excluded from the rankings.
One set of IDEX market data behind every channel: a figure means the same in the Hub, on your website and in the API.
Market Intelligence and its AI Analyst in your team's Workspace, next to your other IDEX tools.
The Market Intelligence widget on your own website, with the modules you choose, styled to your brand in the Widget Designer.
<!-- embed code from the Retailer Hub -->
<script async src="https://tools.idexonline.com/idex-tools.js"></script>
<idex-market-intelligence deployment-id="dep_…"></idex-market-intelligence>
The index, movers, heatmap, supply and volatility as JSON from the IDEX Data Platform API, documented and explorable in the Hub.
GET data.idexonline.com/v1/intelligence/index Tell us about your company. IDEX reviews every request and replies by email. Approved companies choose their products inside the IDEX Retailer Hub.